
EUR/USD is the most traded currency pair in the International Forex Market. Euro and USD are the currencies of the two largest and dominant economies of the world. EUR/USD pair reflects how many Dollars (US) are required to buy a EURO.
EUR/USD Monthly Chart on Short Term Time Frame
EUR/USD Forex Currency Pair concluded negative on Monthly timeframe in February losing -0.12% of overall value in a month. The pair touched the monthly high of 1.1496 on Thursday 10th Feb but was unable to sustain the price and continued its downward trend.
The monthly RSI of EUR/USD closed at 40.9 in a neutral state. Monthly Parabolic SAR closed at 1.1800 which was above the current level, this is an indication of a downward trend. The price is trading below HMA 20 and Fisher Transform 20 on monthly time frames which is a confirmation of the downtrend.
On the other hand, the Volume and Money Flow Indicators are telling the same story. The Value of the Chaikin Money Flow Indicator is trading below zero where the negative value of CMF indicates selling pressure. The value MFI is below the 50% range indicating no interest from the bulls.
The major support levels are lying at 1.0662, whereas 1.0884 and 1.1052 can act as minor support levels. The resistance level is at 1.1832, the EUR/USD can also face minor resistance at 1.1664 and 1.1442.
EUR/USD Monthly Chart on Long Term Time Frame
On the monthly timeframe, the EUR/USD closed below the major Exponential Moving Averages. It is trading below the EMA 50, EMA 100 and EMA 200. EUR/USD currency pair is also trading under the Super Trend indicator and under the baseline of Ichimoku on a monthly time frame. The value of the MACD Histogram is negative and MACD crossover is also signaling a bearish trend on a monthly chart. The EUR/USD is in a strong downtrend on a monthly long-term time frame.
The EUR/USD made a strong Evening Star Candlestick Pattern on a daily time frame on Monday 7th February which is a symbol of the continuation of a bearish trend and high selling pressure from traders and investors in the International Forex Market.
EUR/USD Monthly Technical Analysis for March 2022
EUR/USD is in a strong bearish trend on a monthly time frame. The USD turned out to be very strong against the EURO. There are many reasons which resulted in strong selling pressure in EUR/USD Currency Pair. One main reason for high selling pressure is due to Ukraine and Russia War, this war has disturbed the overall world trade due to the ban on Russian Trade and Russain Companies from the United State and European Union. This overall situation caused a rise in inflation and the prices of commodities around the world have increased. The price of Gold and Crude Oil also went up sharply in February 2022.
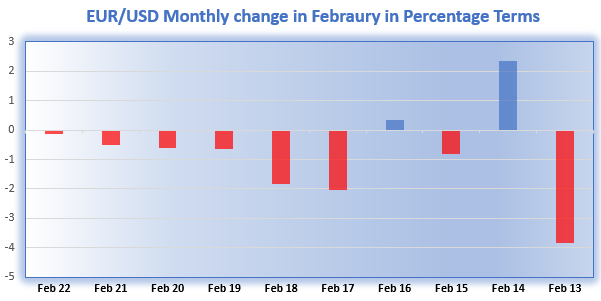
10 Years Historical Performance of EUR/USD in February
The month of February has remained bearish most of the time in the last 10 years. The EUR/USD moved downward 8 times out of 10 in February in the last decade. Feb 2013 was the worst month where the pair lost -3.84% of the overall monthly value. The EUR/USD has an average loss of -0.773% for February in the last 10 years.
EUR/USD Monthly Forecast for March 2022
The volatility has increased in the overall International Forex Market due to present uncertainty throughout the world regarding Russia and Ukraine War and high commodity prices. Our stance is to trade with caution in EUR/USD. The pair can pull back and recover anytime soon if both Russia and Ukraine reached an agreement and Russian troops’ withdrawal starts. The situation can get worse if inflation and commodity prices keep going up. Due to the strong bearish trend on monthly timeframe, it is recommended to Bulls to avoid going long on the EUR/USD pair with large positions on longer time frames. A Bullish Forex Trader can start accumulating EUR/USD on short-term time frames slowly and if the trend reverses in the coming days’ positions sizes can be increased.
For bears, the situation is very satisfying as the bearish trend can continue in the coming days. The bears should look for the 1.0662 support level as the EUR/USD pair can pull pack from this support level in the coming weeks. If the political and economic situation stabilizes a sharp recovery can be witnessed in EUR/USD from the support levels.
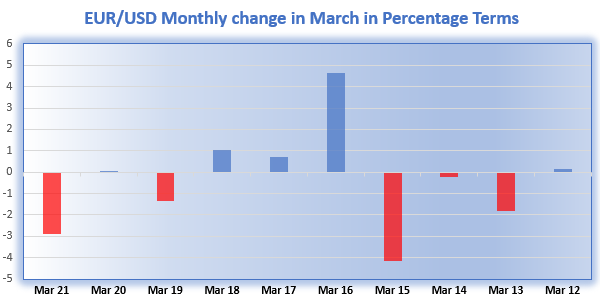
10 Years Historical Performance of EUR/USD in March
The month of March in the last 10 years performed both ways in bearish and bullish directions. In the last decade, March remained bullish 5 times and bearish 5 times. March 2015 was the worst month where the pair lost -4.14% of the overall monthly value. March 2016 was the best when the pair gained 4.66%. The EUR/USD has an average loss of -0.382% for March in the last 10 years.
USD Performance against major currencies in February 2022
USD turned out to be bearish against most of the major currencies and moved in a downward direction against the AUD, NZD, CAD, CHF and JPY in February 2022. New Zealand Dollar came out strongly against the USD where its value increased by 2.81% in February 2022.
| Currency Pair | Change in Feb |
| EUR/USD | -0.12% |
| GBP/USD | -0.19% |
| AUD/USD | 2.80% |
| NZD/USD | 2.81% |
| USD/CAD | -0.24% |
| USD/CHF | -1.11% |
| USD/JPY | -0.10% |
EURO Performance against major currencies in February 2022
EURO currency performed below average against the major currencies due to the Ukraine Russia War. EURO moved in a downward direction against most of the currencies due to the high selling pressure of EURO in the International Forex Market. New Zealand Dollar came out strongly against the EURO where the overall change in New Zealand Dollar is 2.86% against the EURO.
| Currency Pair | Change in Feb |
| EUR/USD | -0.12% |
| EUR/GBP | 0.10% |
| EUR/AUD | -2.81% |
| EUR/NZD | -2.86% |
| EUR/CAD | -0.36% |
| EUR/CHF | -1.24% |
| EUR/JPY | -0.22% |
USD Performance against major Commodities in February 2022
Due to the present global crises of supply chain and War, the prices of commodities shoot up. In February 2022 a major increase was witnessed in the price of US Wheat which increased by 21.90%. All major commodities also witnessed an increase in prices and caused inflation to shoot up in the last month.
| Commodity | Change in Feb |
| US Wheat | 21.90% |
| Heating Oil | 9.21% |
| US Corn | 11.42% |
| Brent Oil | 10.72% |
| Crude Oil WTI | 8.59% |
| Copper | 2.96% |
| Silver | 8.62% |
| Natural Gas | -9.68% |
| Gold | 5.89% |
| Platinum | 2.25% |